https://jonamdall.com/2018/01/01/airline-fleet-totals-leg-room-analysis-revisited/
I’m going to start 2018 by revisiting something I’ve wanted to take another crack at for a while. Four months ago, I wrote a post about carrier/aircraft seat pitch data, inspired by an article about American Airlines ordering new planes with diminished leg room. I found a site called seatguru.com that shares seat pitch (measurement from the bottom end of one seat to the same location on the next) for commercial planes. They are kind enough to allow full spreadsheet downloads, which I data-crunched (functions, pivots, charts) to approximate which U.S. domestic carriers use planes with the most and least leg room. As a large ogre of a person, leg room is always of interest to me.
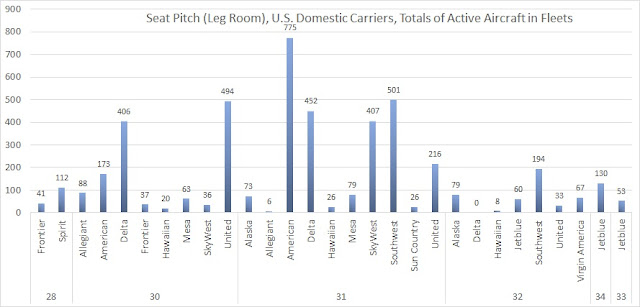
I think about that write-up from time-to-time, because there is so much room for improvement in how it was presented. The primary issue is that seatguru doesn’t provide fleet numbers (total numbers of aircraft each carrier has); it just tells you that X plane type used by Y airline has seat of Z size. So, the charts would tell you American Airlines uses, for example, 9 different types of planes with 34 inches of seat pitch…but don’t tell you how many total planes in their fleet meet that criteria. I’ve wanted to get my hands on that fleet data, because I feel like that might be more valuable to show your likelihood of being cramped on various airlines.
Here are the assumptions, weaknesses, and other important things to consider:
- As I said above, some plane/airline combinations weren’t exact matches. If they were close, I assumed a match. I was pretty conservative about this, so I feel good about it overall. There were a fair amount that did match exactly, though, so that helps.
- Some plane/carrier combinations actually have multiple seat pitch designations on seatguru. In those instances, I always defaulted to the lowest value (economy flying, basically). Some carriers might have premium seats, or maybe exit rows are larger, etc.
- Some planes listed on airfleets.net as being part of a carrier’s fleet didn’t have any match on seatguru. One example is Delta’s Airbus A350; seatguru had A330, but no A350. In cases like that, I just left the seat pitch/leg room completely blank.
- I’m not certain on the date of this information. Seatguru is operated by TripAdvisor, so I’m guessing they keep it pretty up to date. Airfleets.net has a “Fleet Last Updates” page, which shows tons of material being updated as of 12/30/2017. So, I think the data is all pretty recent.
- Airfleets provides numbers for Active, Stored, Written Off, History, On Order, and Total. The information I present will only be from the “Active” column. I wanted to show what you might encounter now when flying.
- This project revealed a weakness of my previous article; that seatguru data included inactive/stored aircraft! Based on comparing to airfleets.net Active/Inactive listings. I didn’t realize that originally.
- Seat pitch doesn’t have a complete correlation to leg room, but it’s the closest available measurement I could find. If seats have more padding or are thicker, it can make pitch a less effective estimate of leg room.

Comments
Post a Comment